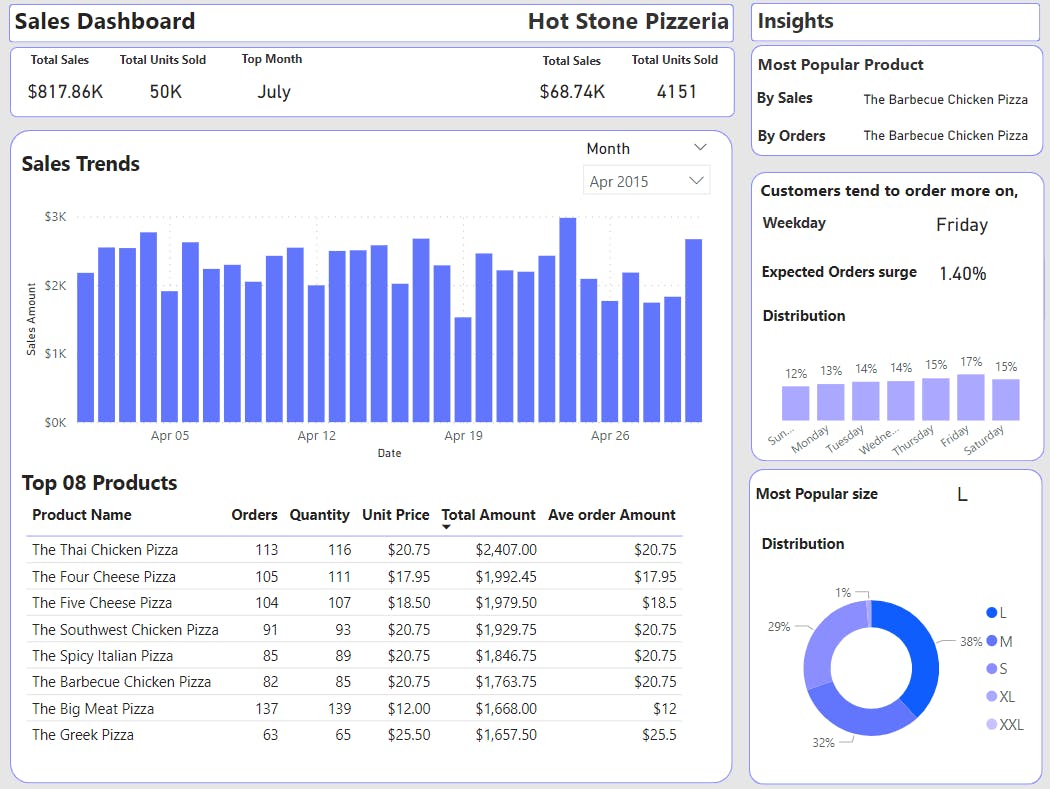
I created a sales dashboard for a Pizza shop 🍕
...as a Power BI portfolio project


Months ago I bump into a guy called Brian Graves on Twitter, a senior data professional (15 years in the business...🤯) and sharing his knowledge on Twitter for free and teaching people like me to become data analysts.
Brian was focused on making good portfolios to help newbies like me to do so. If you're a new data analyst and looking for freelance work, the only thing that builds trust between you and your client is your portfolio (reviews come after).
So I promised myself publicly I make a good-looking portfolio and guess what I couldn't do much about it after 😊
This weekend however I went back to my portfolio project files and attempted to make something new.
My plan was to (with Brian's directions) make something useful to other people/businesses and something that actually serves a purpose, not a fancy technical gimmick that no one understands.
So I created a sales dashboard for a fictional Pizza shop using historical sales data from the year 2015. Here is how I did it.
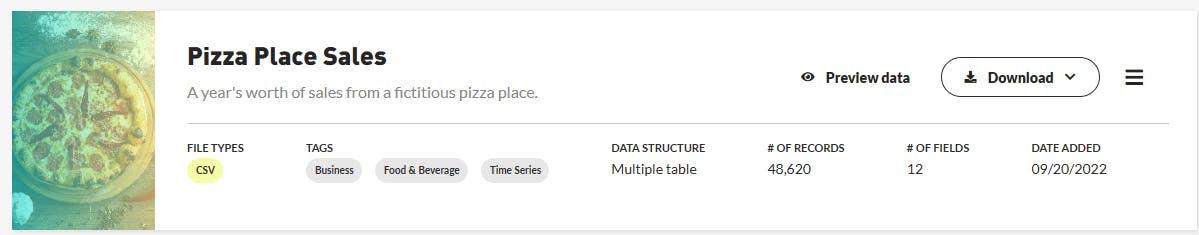
Datasource
Datasource is a CSV file from Maven Analytics' open data playground.
Free Data Sets & Dataset Samples | Maven Analytics
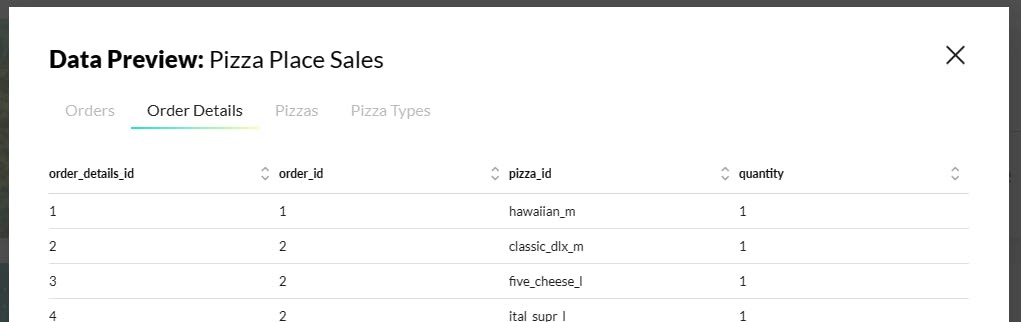
It has 4 tables basically. 3 dimension tables (Pizzas, Pizza Types, Orders) and one fact table (order details).
Thanks fully it's a well-managed dataset used by lots of people before me so not much cleaning to do.
Data Model
A simple star schema would be enough for this. (It doesn't look like a star schema though 😅)
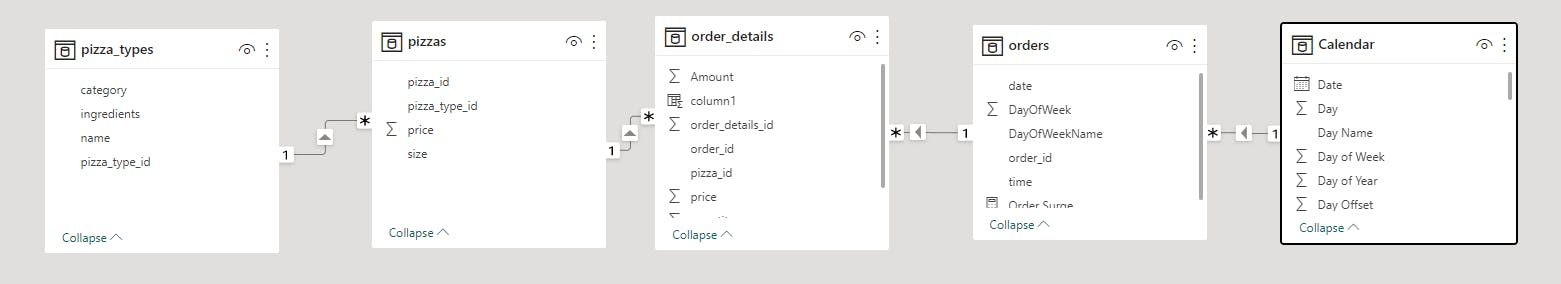
An essential calendar dimension table was added additionally.
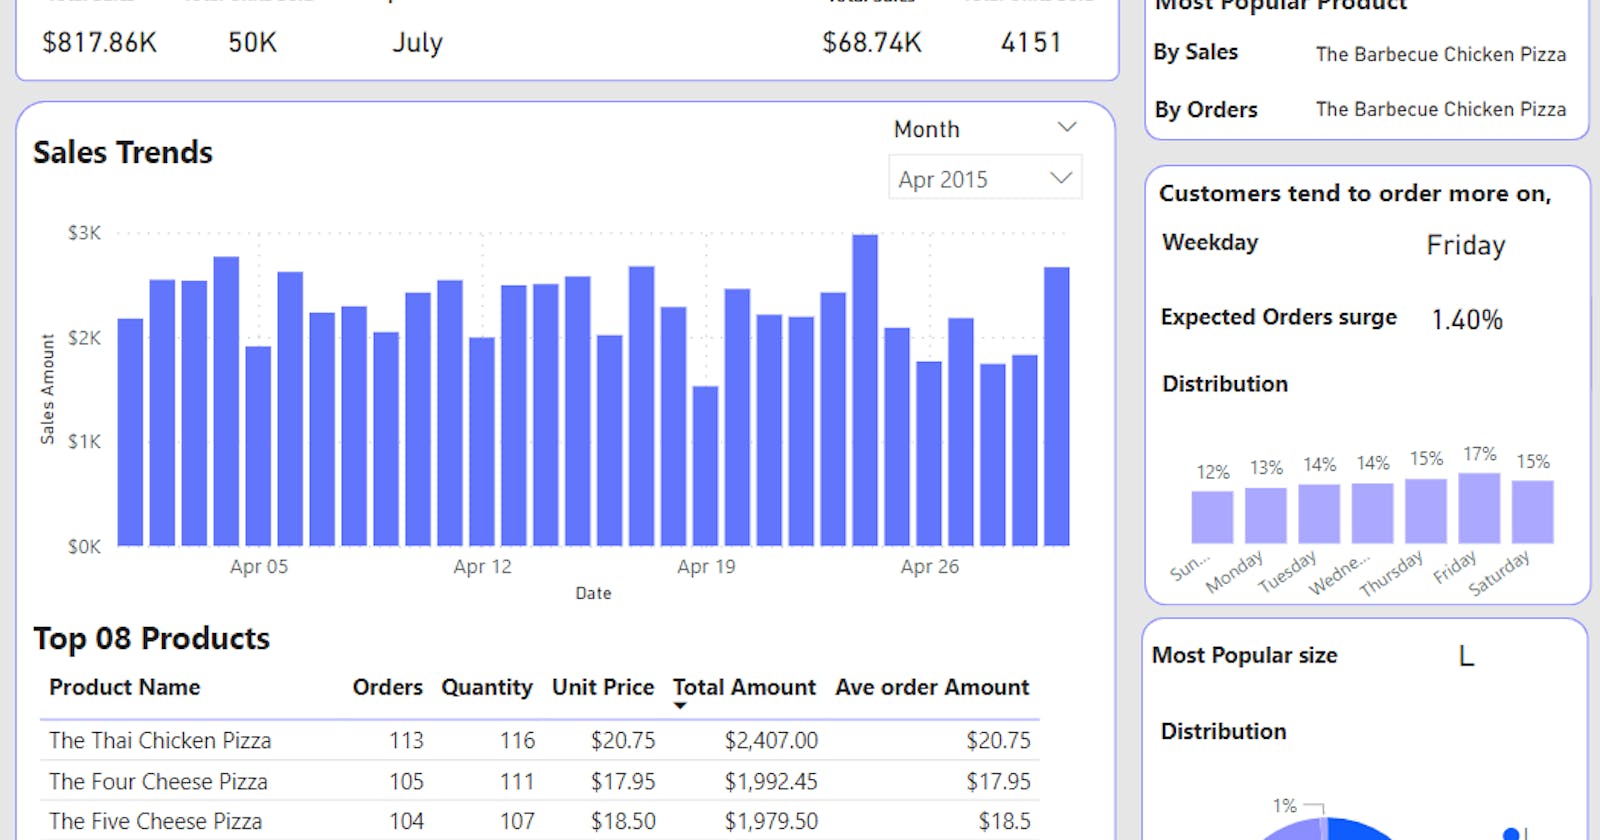
Report
Live report
https://www.novypro.com/project/hot-stone-pizzeria-sales-dashboard
Conclusion
I had so much fun working on it 🤗. Look how cool it is...!