

Table of contents
If you are transitioning to Power BI from Excel, you may have used the SUMIF function to calculate the sum of a range based on a condition. You may have been confused to find out that in Power BI there is no single function to get SUMIF.
Is there a SUMIF() in Power BI
No. SUMIF() is not directly available to use in Power BI. To do SUMIF In Power BI, you need to use the CALCULATE function or CALCULATE and FILTER functions in DAX. In this blog post, I will show you how to use these functions to create a measure that sums up a column based on a given condition.
SUMIF() with one condition using CALCULATE( )
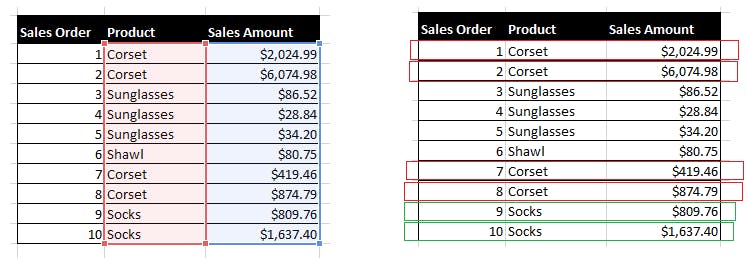
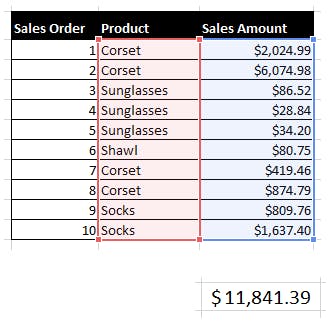
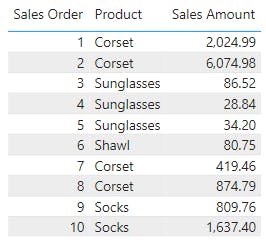
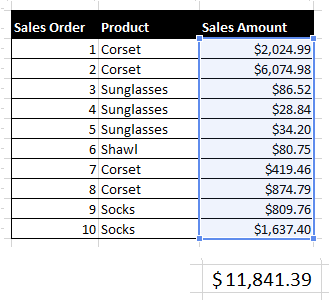
We have a products table with Sales amounts.
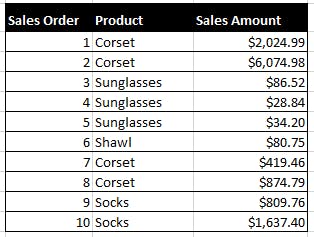
We need to get the sales amount of Corsets.
EXCEL
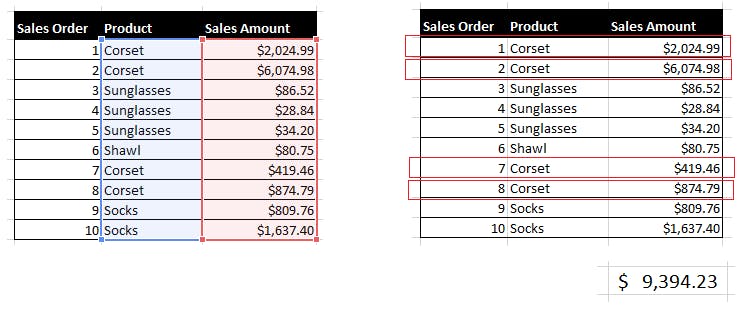
=SUMIF(G19:G28,"Corset",H19:H28)
POWER BI
Create a new measure and add this.
Corset Sales =
CALCULATE (
    SUM ( 'Sales Table'[Sales Amount] ),
    'Sales Table'[Product] = "Corset"
)
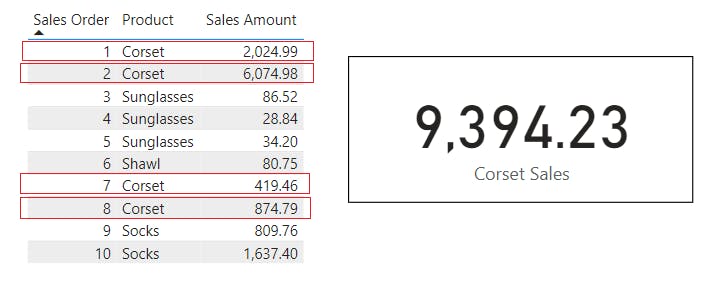
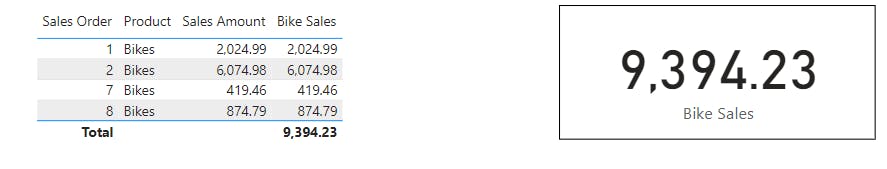
Add a new measure to the table or other visuals.
SUMIF() with multiple conditions on the same column
Excel uses SUMIFS() to filter by multiple conditions.
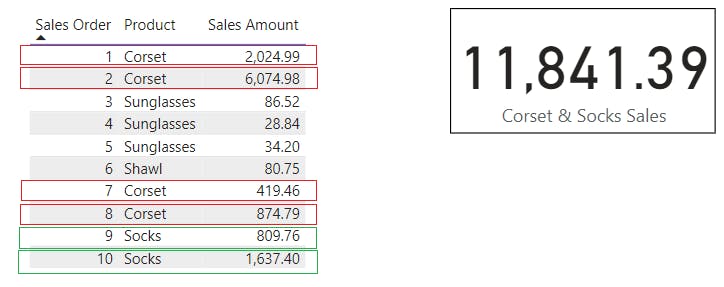
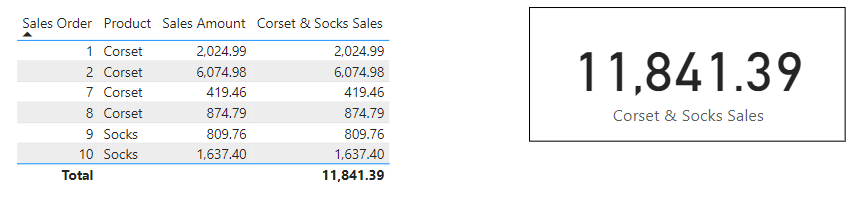
We need to get the sales amount of Corsets and Socks.
EXCEL
=SUM(SUMIFS(H19:H28,G19:G28,{"Corset","Socks"}))
POWER BI
Create a new measure and add this.
Corset & Socks Sales =
CALCULATE (
    SUM ( 'Sales Table'[Sales Amount] ),
    OR ( 'Sales Table'[Product] = "Corset", 'Sales Table'[Product] = "Socks" )
)
Add a new measure to the table or other visuals
SUMIF() with multiple conditions on different columns
Excel uses SUMIFS() to filter by multiple conditions.
We need to get the sales amount of Corsets bigger than 100.
EXCEL
=SUM(SUMIFS(H19:H28,G19:G28,{"Corset","Socks"}))
POWER BI
Create a new measure and add this.
Corset & Socks Sales =
CALCULATE (
    SUM ( 'Sales Table'[Sales Amount] ),
    OR ( 'Sales Table'[Product] = "Corset", 'Sales Table'[Product] = "Socks" )
)
Add a new measure to the table or other visuals
SUMIF() with one condition on a number column
Let's get the total sales amount of orders with sales amounts higher than $ 100.
Here is how you do it in EXCEL
=SUMIF(H19:H28,">100")
Here is how you do it in POWER BI
Create a new measure and add this.
100 up Sales =
CALCULATE (
    SUM ( 'Sales Table'[Sales Amount] ),
    'Sales Table'[Sales Amount] > 100
)
SUMIF() with multiple conditions on a number column
Let's get the total sales amount of orders with sales amounts higher than $ 100 and lower than $ 1000.
Here is how you do it in EXCEL
=SUMIFS(H19:H28,H19:H28,">100",H19:H28,"<1000")
Here is how you do it in POWER BI
Create a new measure and add this.
100 to 1000 Sales =
CALCULATE (
    SUM ( 'Sales Table'[Sales Amount] ),
    'Sales Table'[Sales Amount] > 100,
    'Sales Table'[Sales Amount] < 1000
)
Conclusion
SUMIF() or SUMIFS() functions are not available in their original format in Power BI. Same function can be performed on Power BI data by using a combination of CALCULATE () and conditional operators.