Compare the current month's data with the previous month's data in Power BI.


In this blog post, Let's discuss how to use Power BI DAX to compare data from the last month with data from this month.
We'll start by using the selling price of 5 Products and then move on to,
compare this month's prices with last month's prices of the same 5 products.
Get the difference between the Previous month and the current month.
Add arrow icons based on the difference between the Previous month and the current month.
Compare this month's prices with last month's prices - using PREVIOUSMONTH ()
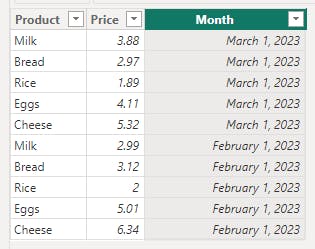
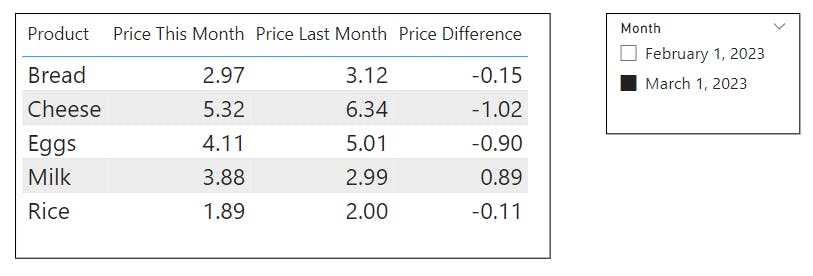
We have 5 popular consumer products and their prices for the last 2 months. (March 2023 and February 2023).
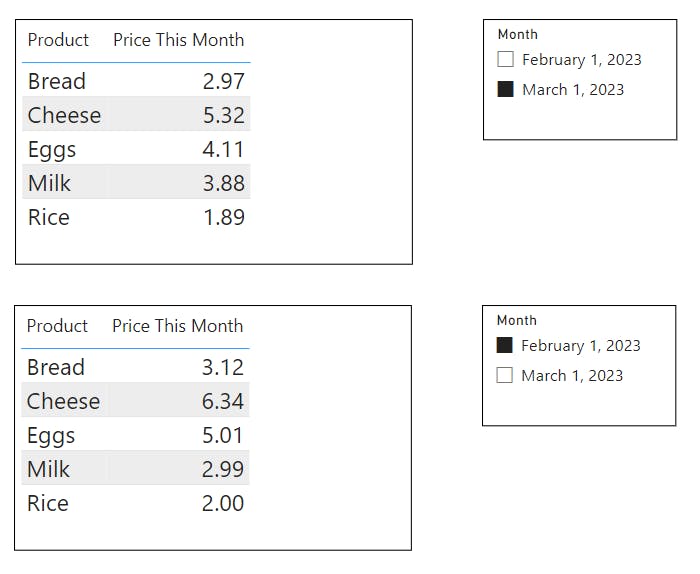
I'm going to create a table visualization on the report canvas for now. Later, when the calculation is done you can turn it into a different visualization according to your need.
A slicer here is added just to demonstrate values from different months in the data set.
create a new measure and add this formula.
Price Last Month =
CALCULATE (
    SUM ( 'Product Prices'[Price] ),
    PREVIOUSMONTH ( 'Product Prices'[Month] )
)
Add the new measure to the tale and select the latest month to check.
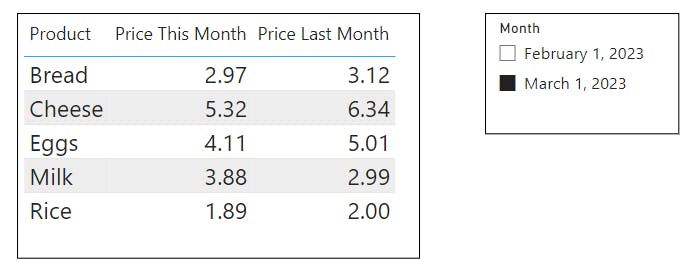
The measure pulls prices from the previous month of the selected date period.
In the formula, the DAX function PREVIOUSMONTH ( ) returns last month's dates in the current context as a filter in the CALCULATE ( ) function. The example above returns February data. If the current context is February, it returns blank as we do not have data older than February.
Compare this month's prices with last month's prices - using DATEADD ()
We can use DATEADD() function to create the same measure.
Price Last Month =
CALCULATE (
    SUM ( 'Product Prices'[Price] ),
    DATEADD ( 'Product Prices'[Month], - 1, MONTH )
DATEADD () function returns a date based on input arguments (Interval number, Interval). In this formula, it returns the date from one month back.
Get the difference between the Previous month and the current month.
create a new measure and add this formula.
Price Difference =
SUM ( 'Product Prices'[Price] )
    - CALCULATE (
        SUM ( 'Product Prices'[Price] ),
        PREVIOUSMONTH ( 'Product Prices'[Month] )
    )
Add the new measure to the table.
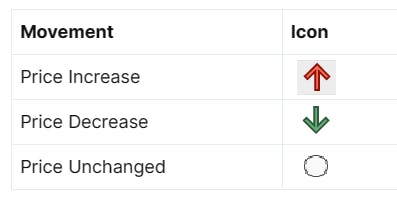
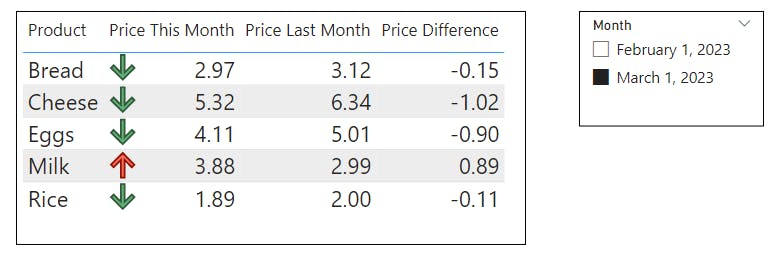
Add arrow icons based on the difference between the Previous month and the current month.
Let's try to add an indicator icon based on the price difference. Here is the rule set.
To do this go to the column you want conditional formatting.
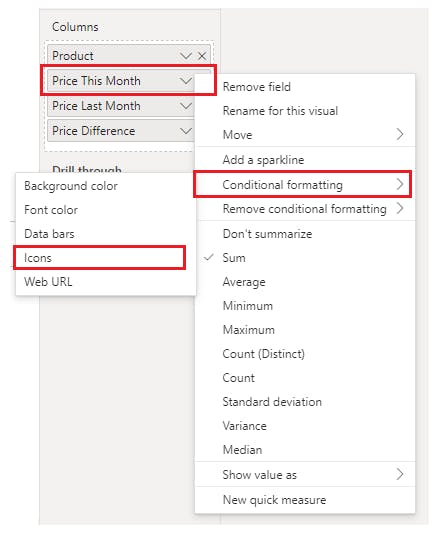
Add the below rules to the "Price Difference" column.
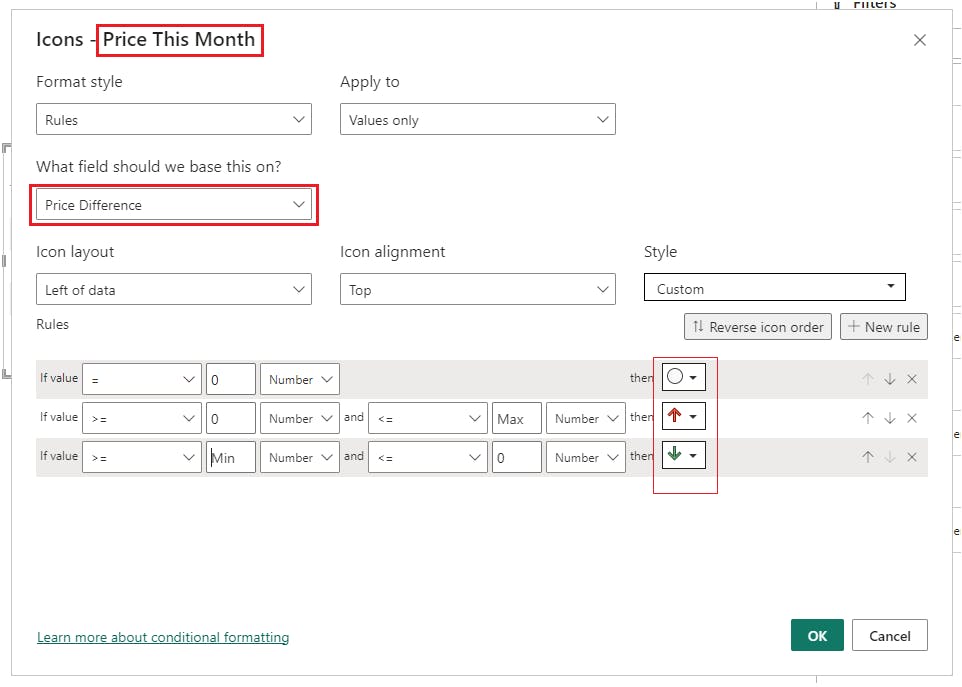
Then the table will look like this.
Compare this month's data with a selected month's data using slicer selection.
In this section let's try to compare this month's data with past data but let the user select which past month to compare.
To do that we need to use 2 different elements.
A column of numbers in a slicer - this is used to select the number of months to get data from.
The measure that uses DATEADD () (This is explained above-need to modify this a little bit)
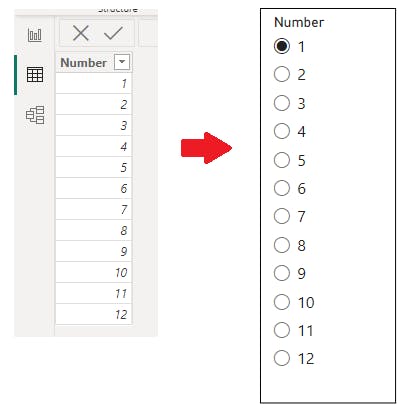
A column of numbers in a slicer
Add a new table with numbers from 1 to 12. Add that column to a single select slicer on the report canvas.
New Measure
Create a new measure and add this formula.
Price Past Month =
CALCULATE (
    SUM ( 'Product Prices'[Price] ),
    DATEADD ( 'Product Prices'[Month], - SELECTEDVALUE ( Numbers[Number] ), MONTH )
)
Add this measure to the table.
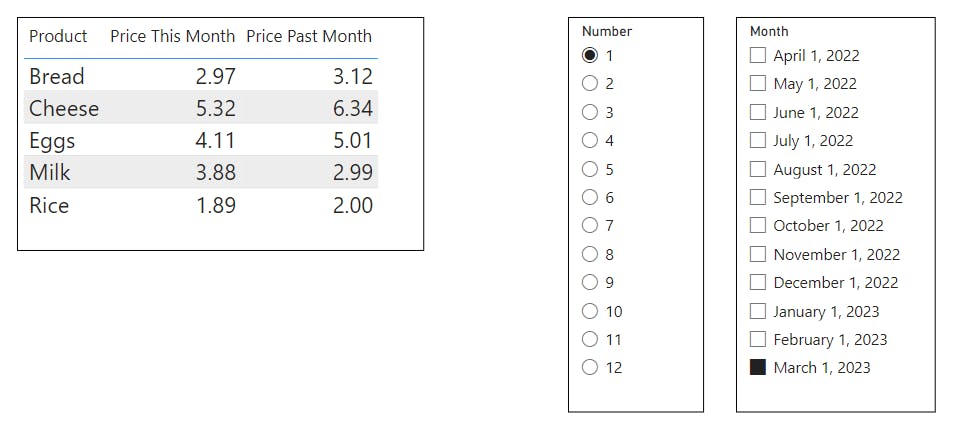
You can select the current month and a number. You'll get data, from a selected number of months back.
Conclusion
You can use a time-series dataset to get old data and compare old data with the current month using DAX measures, calculate differences, and add an indicator icon based on the calculated value.