

Emergency Services Analytics Dashboard - Portfolio Project 🚑 📊


Table of contents
- Datasource
- Data Model
- What insight do we need?
- Number of calls
- The time between the time of call and ambulance departure
- Time is taken for an ambulance to arrive at the patient.
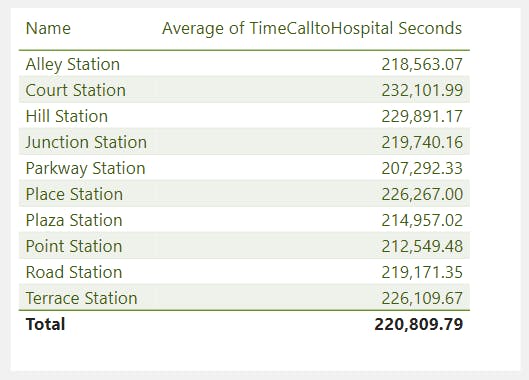
- Time is taken from the patient's house to the hospital.
- No. of jobs between specific periods i.e over lunch times 12:00-14:00
- Does the despatch code affect the timings?
- Does the call handler have any impact?
- Do certain hospitals have issues in a particular aspect?
- What does the data say based on the ambulance station?
- Does patient Sex affect handover times?
- Report Visual Design
- Outcome.
- Insights
This project is done as an entry to Enterprise DNA Power BI Challenge. The challenge was closed for submission last year 😅. But I decided to give it a go anyway.
Here's the challenge link,
Datasource
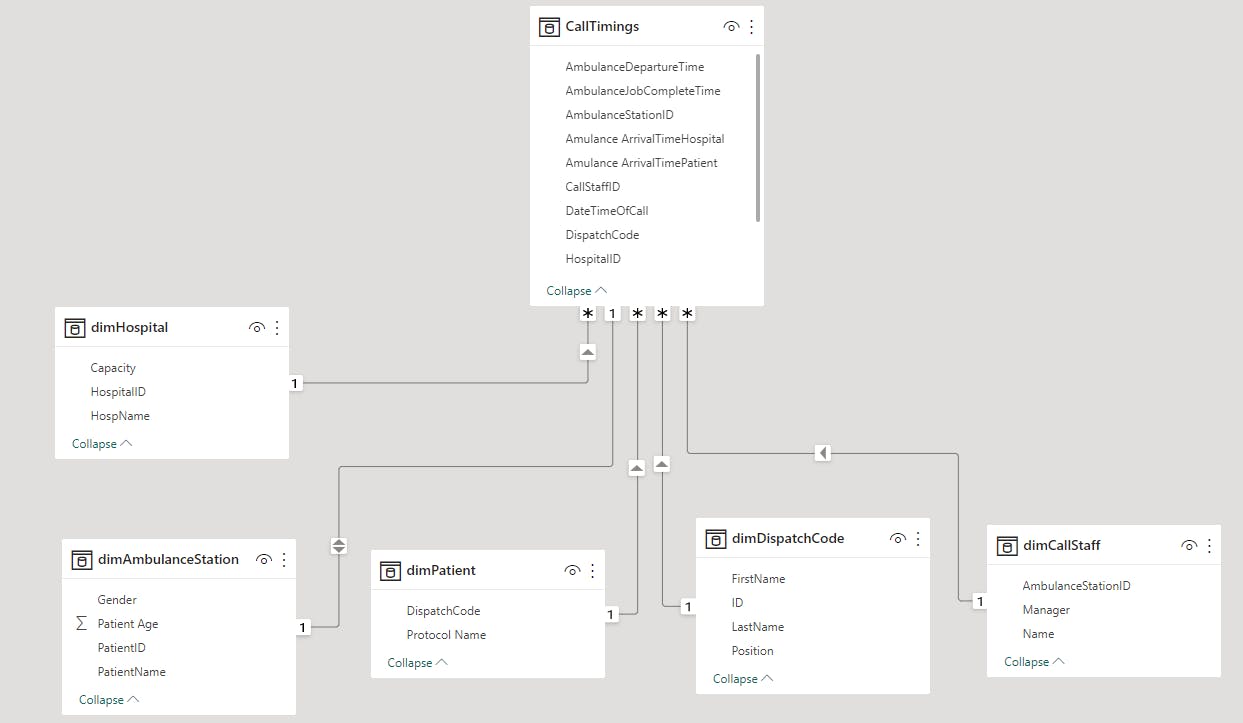
Excel file with 6 tables (fact table and 5 dimension tables).
| Table | Description |
| CallTimings | Fact table |
| dimDispatchCode | Protocols and codes |
| dimCallStaff | Staff names and details |
| dimAmbulanceStation | Station Names |
| dimPatient | Patient Details |
| dimHospital | Hospital Details |
The dataset is collected from the emergency call service. The responding process is given below.
A patient calls 555 >
A member of staff will receive the call (Time Recorded) >
and assign a despatch code >
once the despatch code has been assigned >
The Ambulance will then leave the station (Time Recorded) >
The Ambulance will then arrive at the patients house (Time Recorded) >
The Ambulance will then arrive at the Hospital (Time Recorded) >
Then there is one final Timestamp for when the job is complete >
Data Model
Perfect and simple Star schema.
What insight do we need?
No of calls
The time between the time of call and ambulance departure.
Time taken for an ambulance to arrive at the patient.
Time taken from patient's house to hospital.
No. of jobs between specific period i.e over lunch times 12:00-14:00
Does the despatch code affect the timings?
Does the call handler have any impact?
Do certain hospitals have issues in a particular aspect
What does the data say based on the ambulance station?
Does patient Sex affect handover times?
are a few.
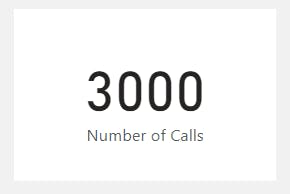
Number of calls
The calls facts table has no unique ID but as the patient number is unique we can use that.
Number of Calls = DISTINCTCOUNT(CallTimings[Patient ID])
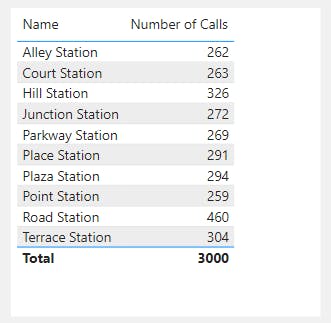
Calls by Station.
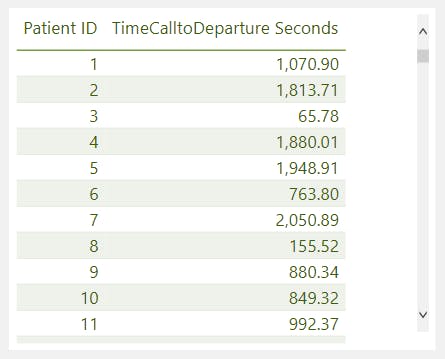
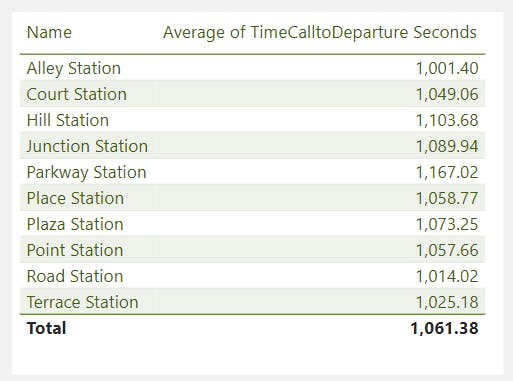
The time between the time of call and ambulance departure
For this, I went back to Power Query and created a new custom column.
 TimeCalltoDeparture Seconds =
(Duration.Hours( [AmbulanceDepartureTime]-[DateTimeOfCall]))*60*60 + (Duration.Minutes( [AmbulanceDepartureTime]-[DateTimeOfCall]))*60 + Duration.Seconds( [AmbulanceDepartureTime]-[DateTimeOfCall])
resulting column converted to decimal and I got this.
Averages per station look like this. I can explore more
Time is taken for an ambulance to arrive at the patient.
TimeDepaturetoPatient Seconds = (Duration.Hours( [Amulance ArrivalTimePatient]- [AmbulanceDepartureTime]))*60*60 + (Duration.Minutes( [Amulance ArrivalTimePatient]- [AmbulanceDepartureTime]))*60 + Duration.Seconds( [Amulance ArrivalTimePatient]- [AmbulanceDepartureTime])
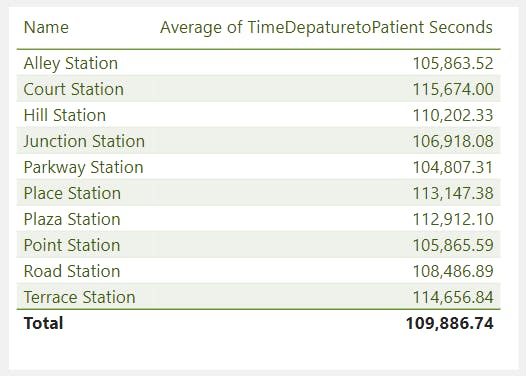
It looks like the departure to the patient for each is around 30 seconds. We can analyze that more later.
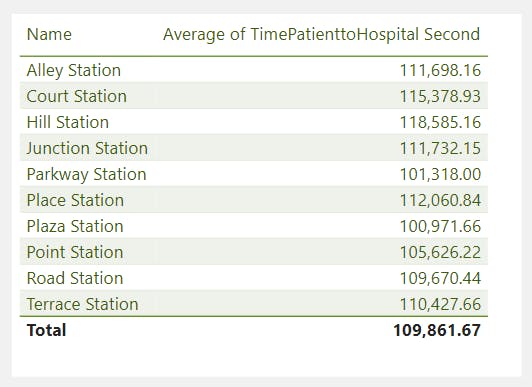
Time is taken from the patient's house to the hospital.
TimePatienttoHospital Second = (Duration.Hours( [Amulance ArrivalTimeHospital]- [Amulance ArrivalTimePatient] ))*60*60 + (Duration.Minutes( [Amulance ArrivalTimeHospital]- [Amulance ArrivalTimePatient] ))*60 + Duration.Seconds( [Amulance ArrivalTimeHospital]- [Amulance ArrivalTimePatient] )
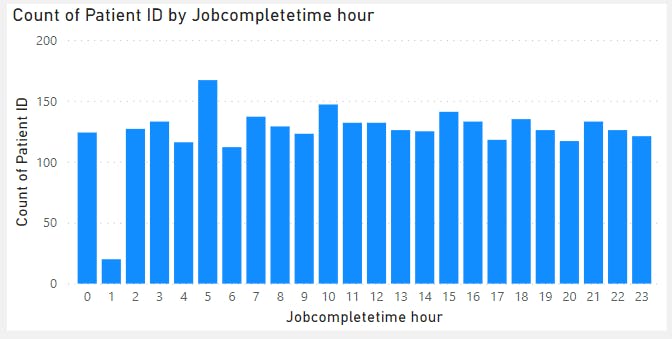
No. of jobs between specific periods i.e over lunch times 12:00-14:00
This can be observed by using call distribution over time series. To do that we need to categorize time data into 24 hours.
The new column.
Jobcompletetime hour = Time.Hour([AmbulanceJobCompleteTime])
This fetches the hour element from the DateTime value.
The draft chart for all stations looks like this.
Does the despatch code affect the timings?
New column.
Time to complete = [TimeCalltoDeparture]+[TimeDepaturetoPatient]+[PatienttoHospital]
We can see some division by dispatch code.
Does the call handler have any impact?
Does the call handler have any impact on the completion time?
we already have the completion time calculated.
Do certain hospitals have issues in a particular aspect?
In this one, we need to study whether any hospital has any notable spike in complete-time or high call frequency.
What does the data say based on the ambulance station?
we can dig into this.
Does patient Sex affect handover times?
We already gave patients' sex as a column. Let's try to get a rough look at what it can be.
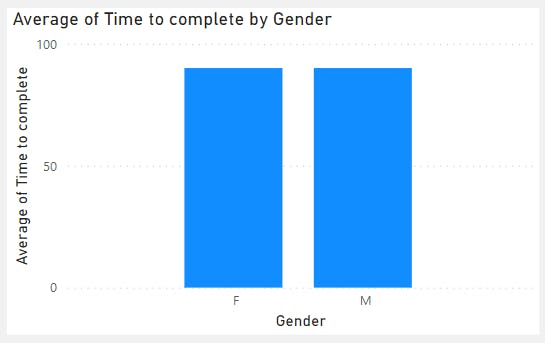
We cannot see a notable difference overall but we can dig deeper into this later.
Report Visual Design
Columns and calculations needed are done (hopefully...😁). Let's move on to visual developments.
Color palette

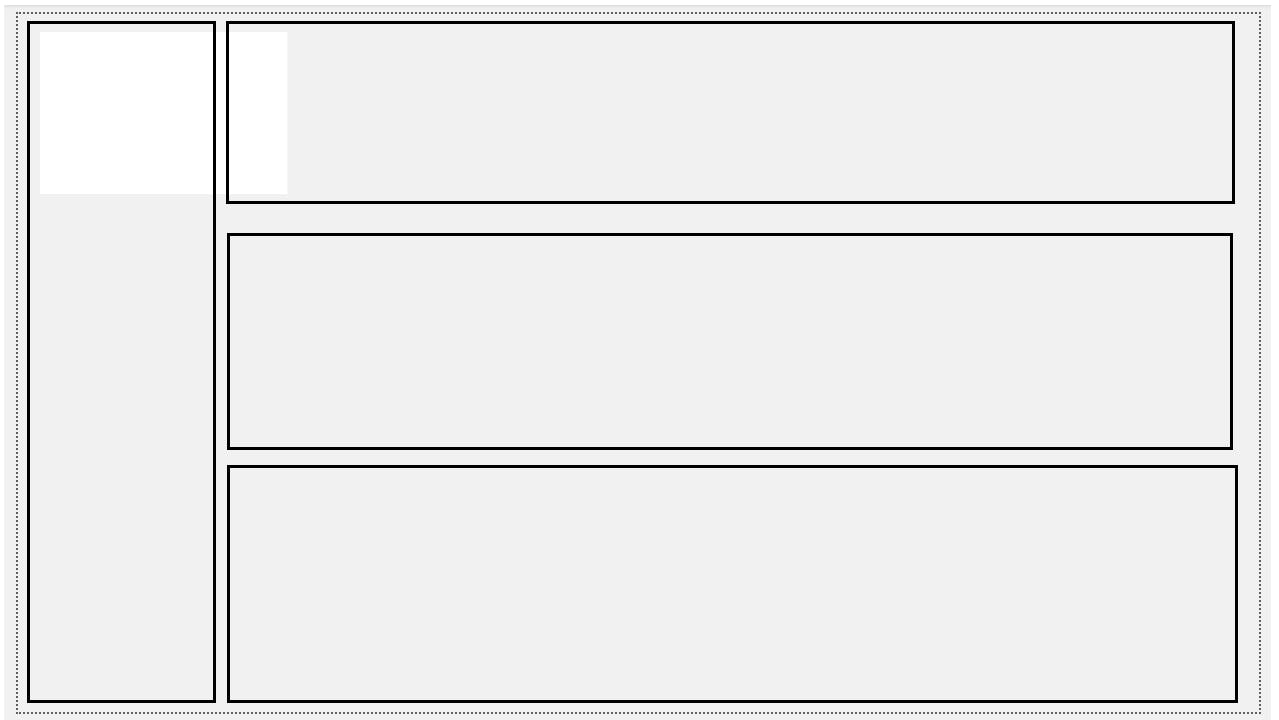
Layout
The rough layout looks like this. When the design starts, I imported this as the canvas background as a guide.
Outcome.
Insights
3000 calls have been answered and processed up to the point where the person in distress is safely handed over to the hospital
Operators spend an average of 11.1 minutes on the phone.
The medical team departed within 17.1 minutes of the call
The medical team reached the patient within 15.1 minutes
The patient was handed over to the hospital within 10.9 mins
The time to complete one protocol is 43.7 minutes
Completion time by the hour of the day
41.64 minutes is the lowest completion time and this time was recorded around 4.00 pm in the evening.
157 calls were answered around 4.00 am and it's the maximum number throughout the day.